
Everything looked fine — until it wasn’t. Out of nowhere, our worker tier started throwing this error:
could not obtain a connection from the pool within 5.000 seconds (waited 5.000 seconds); all pooled connections were in useWe weren’t doing anything wild. Our RAILS_MAX_THREADS matched the DB pool size. No rogue threads. No unclosed connections. And yet, we were stuck.
Here’s how we tracked it down and what we learned from it.
The next guess
The very next thing you might think is that your application might be spawning new threads from within your application code. You go off on a hunting expedition to find out that there is nowhere in your code that you are deliberately spawning new threads.
Going back to the basics
After a few failed guesses, we decided to add some debugging information so we could narrow down the issue. Thankfully, there's a way to get connection pool info via ActiveRecord::Base.connection_pool.stat. What if we log those stats around the time the leak is happening—along with the owners of the connections? That would look something like:
def log_connection_stats
  pool = ActiveRecord::Base.connection_pool

  pool.connections.each_with_index do |connection, index|
    line_log = connection.owner.present? ? connection.owner.inspect : '[FREE]'
    Rails.logger.info("[ConnectionStats][#{index}] #{line_log}")
  end

  Rails.logger.info("[ConnectionStats] #{pool.stat.inspect}")
end
We had noticed that the issue was happening only within our worker tier, not our web. And the connection timeout would occur exactly when ActiveJob was deserializing ActiveRecord objects. That said, all we had to do was to hook the code above into a rescue_from from ApplicationJob (which inherits from ActiveJob).
rescue_from ActiveJob::DeserializationError do |error|
  unless error.cause.is_a?(ActiveRecord::RecordNotFound)
    log_connection_stats
  end
end
Nailing it down
Once this debugging info was up in production, it didn't take long to see the issue. And 🎉:
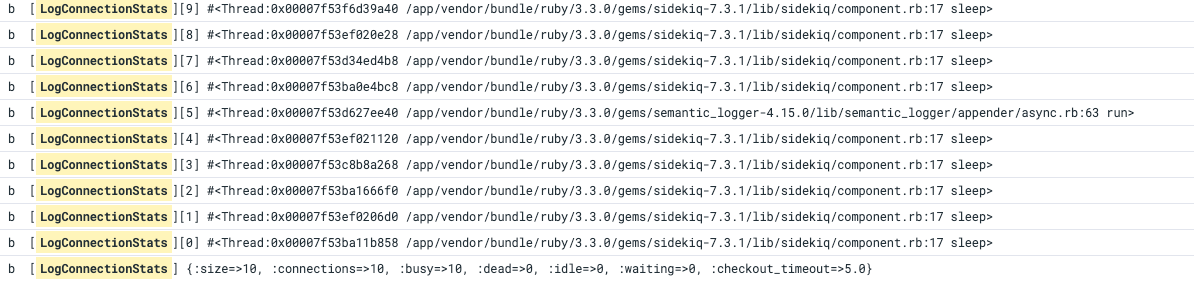
From these logs, it became very clear that the semantic logger was holding onto a connection. But why? Why would a logger hold onto a connection?
Well, Semantic Logger kicks off a thread for processing log entries. That alone doesn't explain it holding onto a connection. The only way it would be is if somehow it were executing a query from within its processing thread. How could that happen? Only if we were sending some lazy object to the logger and it is trying to resolve the object, and while doing so it hits the DB. Is that possible? Oh yes, very possible. You could send an AR Relation to the logger and it would resolve that relation within the logger's thread, and that would make the thread own the connection. With this theory in mind, we went looking for places in the code where we could potentially be sending an AR Relation to the logger. After looking at a few files, we found:
Rails.logger.info("<REDACTED>", { records: <AN-AR-RELATION-OBJECT>, ... })Since this is unexpected and our connection pool size only matches our workers' concurrency, whenever our workers were all busy and this log line was being sent, we would see the connection error (all pooled connections were in use). The fix was to just turn records into primitives like IDs. Sending a relation to the logger was mainly an oversight on our part, we should only be logging primitive non-sensitive data.
After pushing the fix - voila 🎉 - we haven't seen the connection issue anymore.
Takeaways
This wasn’t a typical connection leak. It was more like an accidental hijacking — a background thread holding onto a connection because we passed it a lazy object (an ActiveRecord relation) that wasn’t meant to be evaluated there.
A few lessons came out of this:
- It goes without saying, avoid passing ActiveRecord relations or any lazy-loaded objects into logs or background threads. Always log primitive values.
- When in doubt, log connection_pool.stat and the owners of each connection. It’s incredibly helpful for debugging.
- Even with all the right configs (
RAILS_MAX_THREADS= pool size), subtle misuse of threads or lazy evaluation can break assumptions. It’s a good practice to add some headroom to your DB connection pool size and monitor it for spikes above your expected concurrency. That way, you create a buffer for mistakes that might otherwise impact customers and get alerted when an unexpected connection owner shows up.
About the Author
Victor is a Full Stack Engineer at BetterUp with a strong passion for software quality, learning new technologies, and building scalable products and systems. It all started when he first joined a startup in 2012, now he has amassed over a decade of industry experience.


Join the conversation