
Over the past year, at BetterUp we have built an in-house feature store called Lens that provides a unified surface and interface to query across heterogenous data stores, mostly used for prompt context use cases.
Under the hood, Lens is an async FastAPI Python server that highly leverages Python’s asynchronous programming framework asyncio - leveraging this programming model effectively allows this system to be highly concurrent and lightweight. Especially as Lens is dominantly an I/O-bound program making requests to Elasticache/Redis, and upstream data sources like the different backends or Snowflake, it avoids many of the pitfalls of using thread pools or synchronous FastAPI as ultimately spinning up threads is heavier weight (needing to spin up thread stacks, incur OS scheduler overhead, and context switch costs) than using coroutines that are effectively multiplexing these small tasks within a small number of threads tied to the event-loop.
Houston, we have a leak!
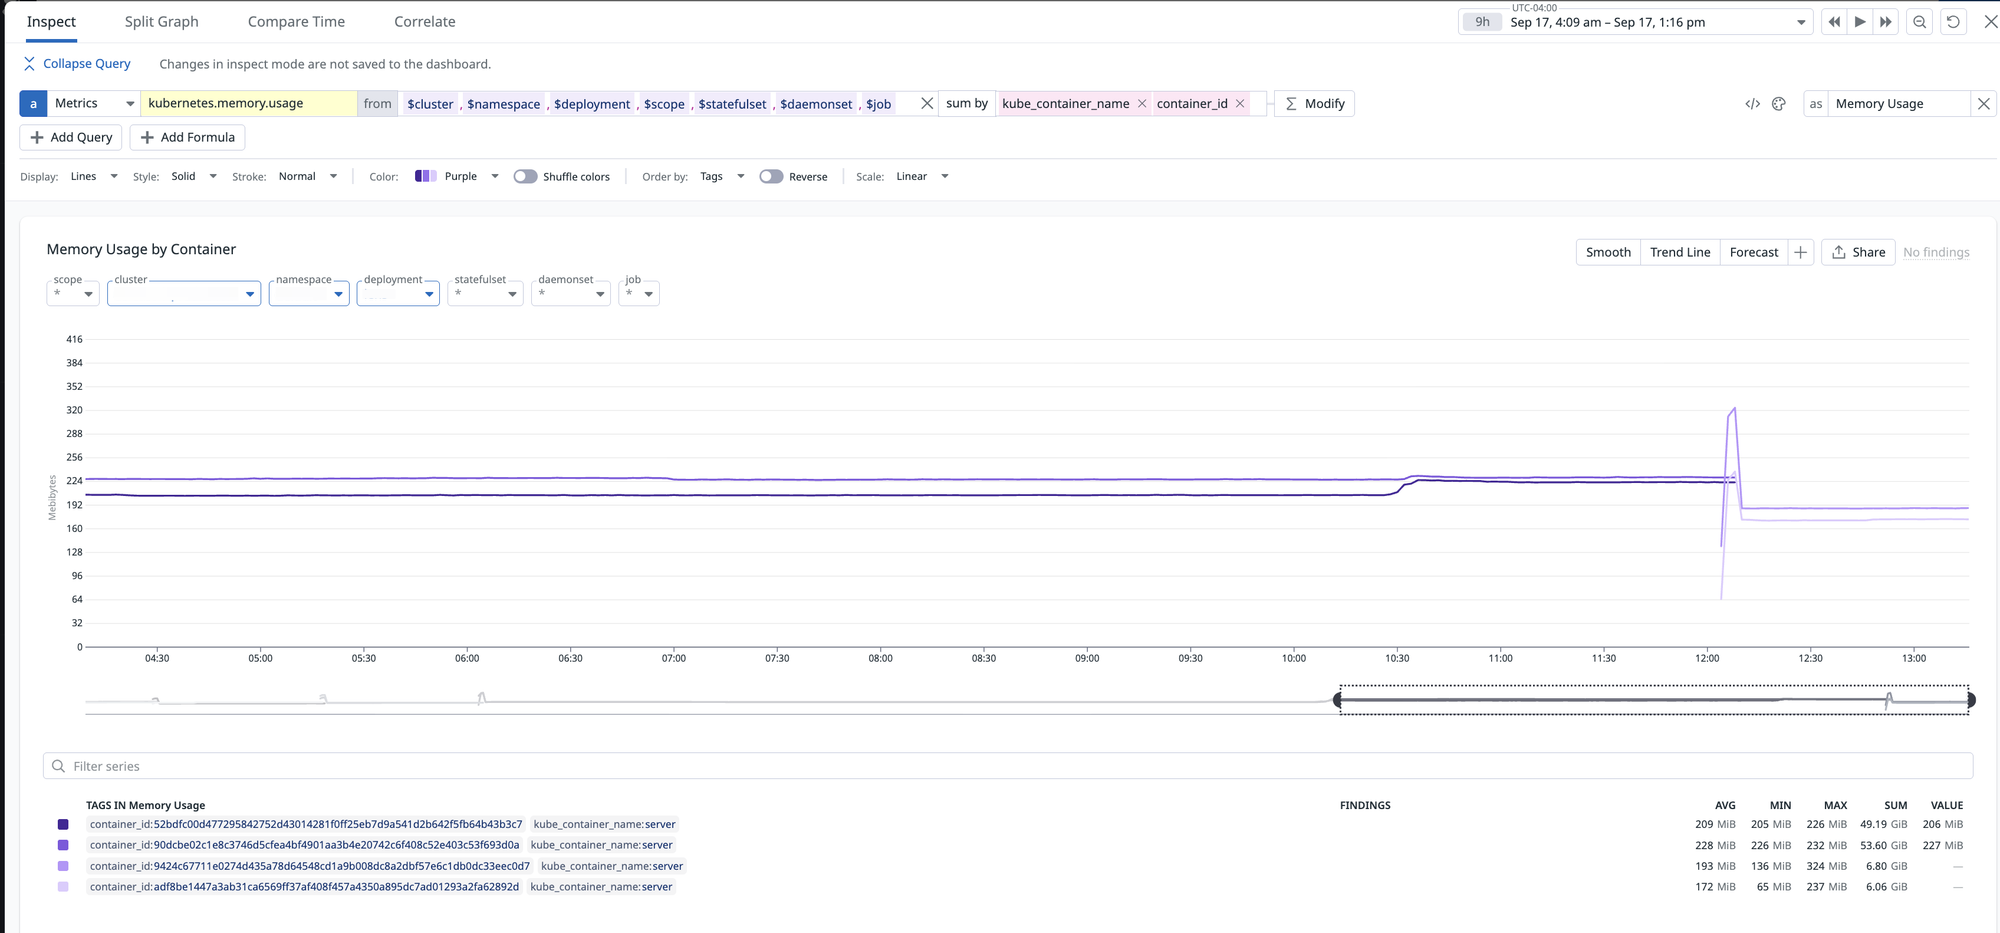
After deploying a PR on August 6th that introduces a Snowflake connector - we start seeing memory slowly creep up overtime. If we look at the resident set size (RSS, total amount of physical memory used by the Python process), we see that at that point, it starts growing linearly. Note that when you see it dipping back to ~180 MB, that is due to the container getting redeployed so a new process is booted up:
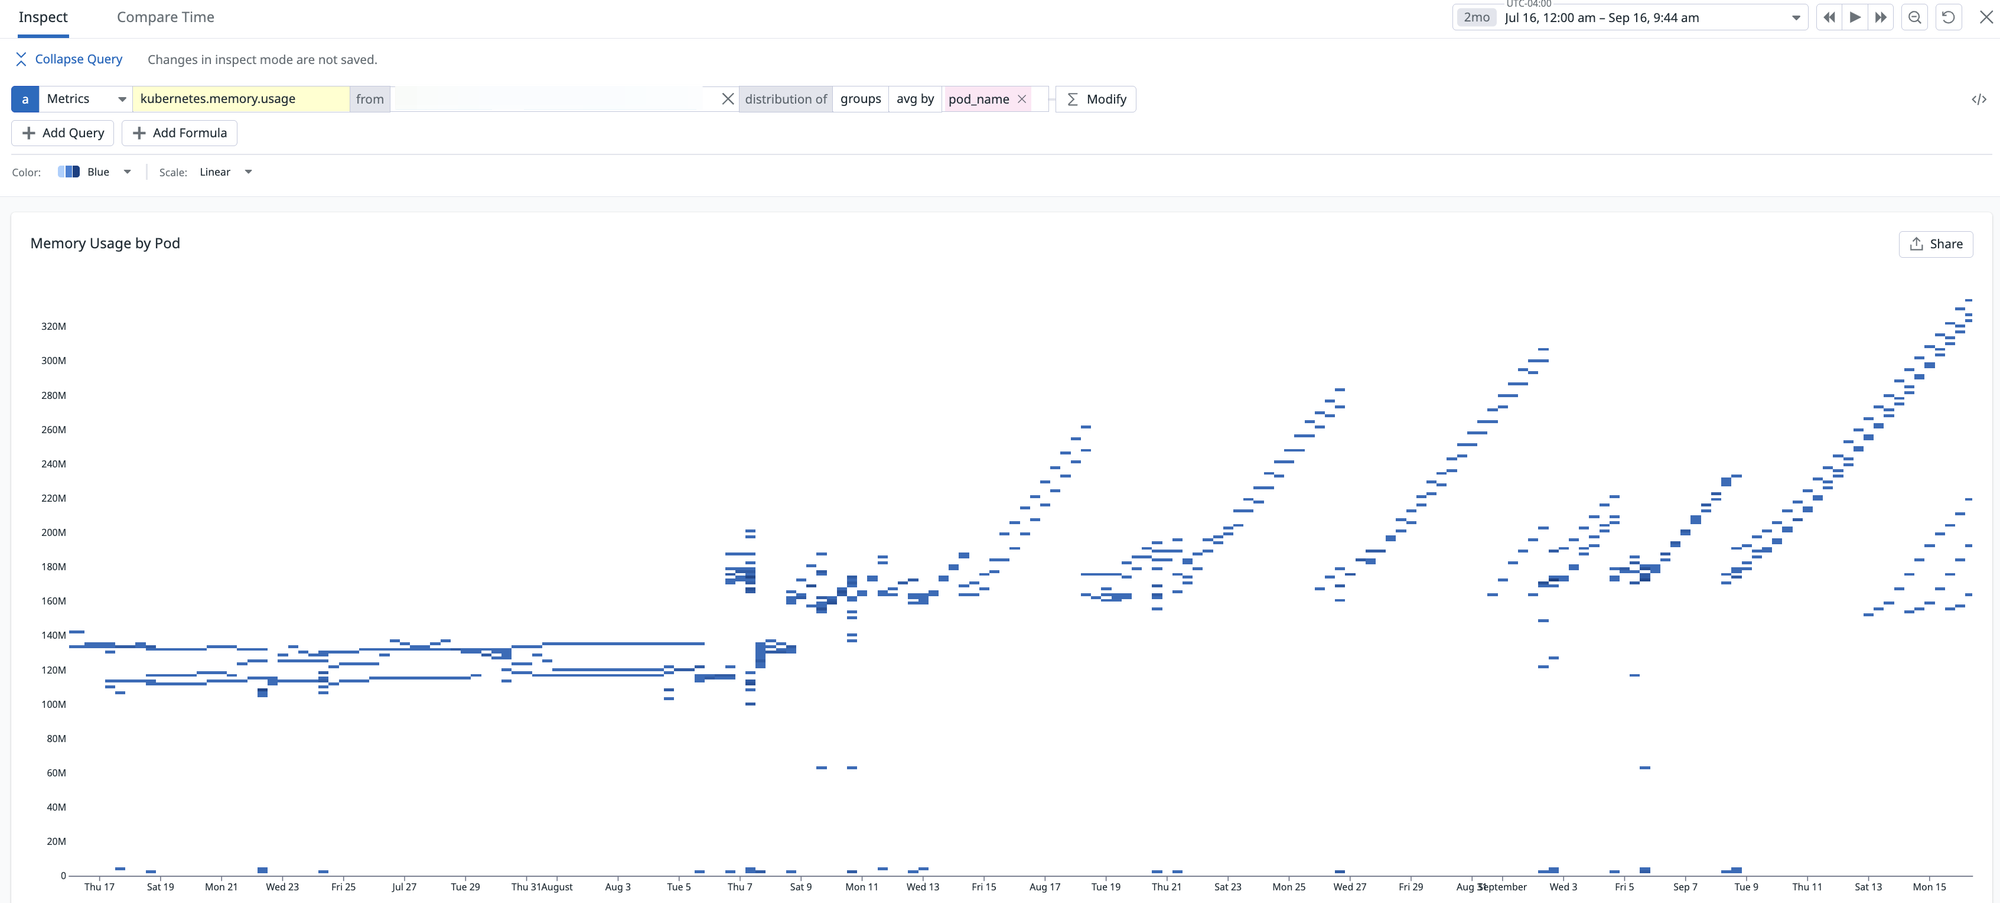
This trend is concerning for several reasons. First, it suggests we may have on our hands a memory leak: over time the process’s RSS creeps upward and can eventually exhaust available physical memory. That first leads to performance degradation since the allocator has to work harder to satisfy requests when large contiguous regions are scarce (Swiss cheese-like virtual address spaces), and then eventually leads to OOMs. Second, our horizontal pod autoscaler is configured to scale on memory utilization (which is appropriate for an I/O-bound service like Lens, where CPU utilization is very low so memory is the bottleneck). As a result, once RSS crosses the autoscaling threshold, Kubernetes spins up additional pods unnecessarily. That drives up compute consumption and inflates our AWS bill without actually improving throughput - wasting compute and wasting money, yuck. Anecdotally, there were times where we have seen that we have max pods running, although actual request traffic is lower. We were simply scaling due to memory pressure from the underlying system itself.
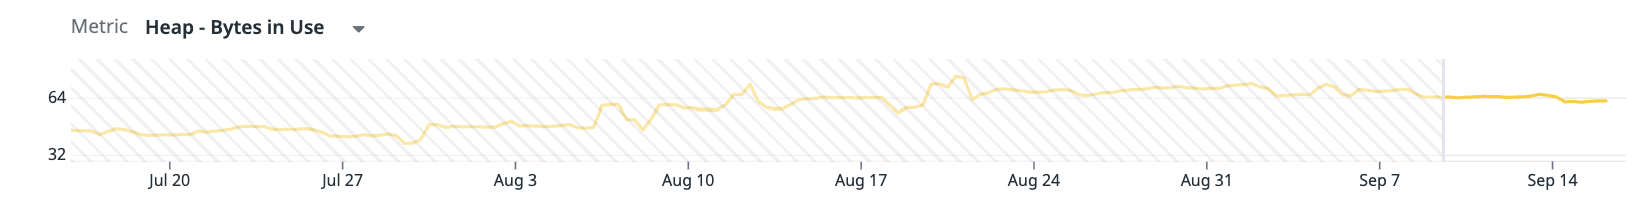
That said, we are profiling the Lens app using DataDog’s profiler which is incredibly helpful for us because we can see the Python heap size remained stable. This is an important clue, as it suggests the leak is unlikely to originate from Python-level code and is more likely tied to native extensions or the underlying system allocator.
A brief look into Python’s memory management model
All Python objects and values are allocated on the heap. Under the hood, it runs CPython where there are two memory allocators used:
pymalloc- Python’s small object allocator which manages distinctly Python objects that are up to 512 bytes in size. These are used for most Python objects that representlist,str,dict,int, etc.- System allocator - for allocations of Python objects > 512 bytes or C-extension objects that call malloc/free. As we are using the
snowflake-python-connectorlibrary, that uses Arrow under the hood which allocates large columnar buffers for query results.
These two allocators each manage their own memory allocations within a Python process’s virtual address space.
Memory lifetime is controlled by CPython’s reference counting (RC) and a garbage collector (GC) that detects cycles. Every Python object maintains a reference count (refcount) which is incremented or decremented as references are added or removed. To release memory after use, free is called in two scenarios:
- When the refcount drops to 0, the object is immediately deallocated - its destructor runs, and its memory is returned to the corresponding memory allocator (pymalloc or system malloc). That said, logically freed memory may not always be immediately handed back to the OS, so the pages may still be mapped in RSS.
- The GC runs periodically to identify and break reference cycles, ensuring that even objects involved in cycles eventually reach refcount 0 and are subsequently freed so the memory is returned to the corresponding malloc (i.e. their free list).
In both cases, the allocator returned to is pymalloc’s free list for small objects and the system allocator’s memory pool for larger objects/extension allocations. As we will see soon, the system allocator’s implementation of free and how the malloc purges freed/unused memory will greatly affect memory utilization.
The Investigation
When we introduced the Snowflake connector, we also implemented a custom connection pool. Initially, our suspicion was that the pool itself might be leaking stale connections or unintentionally allowing unbounded growth. Another possibility was that we were not properly closing cursors. But this turned out not to be the case, since we were using context managers, which automatically close the cursor once execution leaves the block.

Furthermore, the fact that the Python heap size did not grow in step with RSS is a useful signal. If either the connection pool leaking or the cursor leaking memory were true, we would expect to see a correlated linear increase in the Python heap size, since connection and cursor objects are allocated on the pymalloc-managed heap. The absence of such growth strongly indicates that the leak is not in the Python-level connection pooling code.
Hence, we can begin ruling out Python-level code as the source of the problem. This instead points to two likely possibilities:
- A genuine memory leak in a native extension used by the
snowflake-python-connector. - An issue with the underlying C library build that we installed in the container - namely, the
snowflake-python-connectorlibrary is a thin wrapper aroundlibsnowflakeclient, a C/C++ library that handles networking, authentication, encryption (OpenSSL), data compression, and Arrow buffer management. If the build of this library in our container is misconfigured or compiled with incompatible options, it could cause memory not to be released correctly.
A genuine memory leak in the Snowflake connector’s native extensions such as Arrow or the client routines is less likely. Both Arrow and the snowflake-python-connector are widely used in the Python community for data pipelines - and they are mature projects with active maintenance. If there were a systemic memory leak in their core native code paths, it would almost certainly have been reported and visible as an active issue on the corresponding repos. While regressions are possible, the probability that we are the first to encounter a major leak in such heavily used libraries is, in our view, relatively low.
Due to that, we took a deeper look at our Python system’s Dockerfile to examine the build library.
FROM python:3.13-alpine

# dependencies for snowflake-python-connector
RUN apk add --no-cache \
    build-base \
    g++ \
    libffi-dev \
    libstdc++ \
    musl-dev \
    gcc \
    openssl-dev \
    cargo \
    cmake \
    make
The line prefixed with RUN apk … as shown were added in the same PR that we introduce the snowflake-python-connector and the Snowflake connector/connection pool. These are needed to compile and run the native extensions for the snowflake-python-connector library.
We see that our container is built on Alpine Linux, and we see it uses musl as its C standard library. musl provides its own lightweight implementation of malloc. Aha! That may be it. We may be dealing with a case of memory fragmentation rather than an actual memory leak now depending on how the allocator is designed.
After researching a bit more, we find that the musl’s default allocator, while simple and has a small-footprint, lacks a lot of fine-grained memory control (more on this in a bit). As such, our new hypothesis was that the usage of musl’s malloc was the culprit. In particular, in the C-native code, whenever a free is called logically, under the hood the allocator may not even return those pages back to the OS which leads to memory fragmentation and RSS slowly creeping up over time.
What initially threw us off in the investigation was when we read an article that stated that for Ruby apps (mind you, we are a Python app), memory fragmentation results in RSS creeping up logarithmically while a true memory leak under steady app traffic increases almost linearly. Going back to our RSS chart, we saw that RSS was increasing linearly. So while we had the suspicion that we were dealing with a memory fragmentation issue, reputable sources seemed to suggest otherwise. That said, it is important to note that while Python and Ruby memory models are similar in some broad sense, there are still quite a bit of implementation differences so what may be true for Ruby apps, may not be true for Python apps.
Hence, we had to test and measure it out. It was certainly worth a shot to try swapping out musl’s default allocator for one that is in theory more performant for highly concurrent production applications. So after some research and reading some engineering blog articles (the infamous Zapier engineering blog that claims jemalloc saved 40% of memory in their Python app) and (drumrolls please…) Reddit, we turned to jemalloc, an allocator designed for highly concurrent, high-throughput production systems. Sounds perfect for an async FastAPI app.
Aside: We’ve seen some folks online claiming jemalloc greatly reduced the memory footprint and fragmentation of their apps while others claimed jemalloc bloated the runtime and didn’t do the trick for their apps. That said, as with anything, we had to test it out for ourselves to see how it fares.
Testing out jemalloc
We swap it out the default allocator (and thin out the runtime a bit more haha) in the Dockerfile:
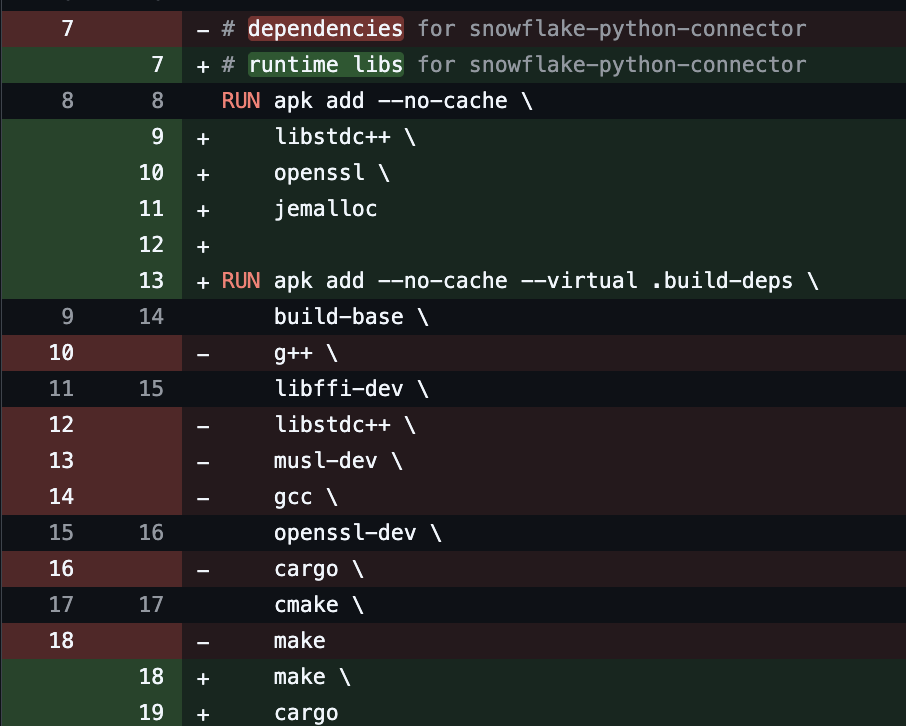
We preload jemalloc (LD_PRELOAD=/usr/lib/libjemalloc.so.2) and configure it with a background purger (background_thread:true) and short decay times (dirty_decay_ms:1000, muzzy_decay_ms:1000). In jemalloc terms, dirty pages are freed pages that still contain old data and remain resident until explicitly purged, while muzzy pages are freed pages that jemalloc has marked with a flag, MADV_FREE, meaning the OS may lazily reclaim them, but jemalloc can also reuse them quickly if they remain intact.
The decay settings in milliseconds control the rate at which jemalloc gradually purges freed pages back to the OS. Specifically, each setting is a half-life - on average, half of the pages in that state are purged every N milliseconds, so memory usage decays exponentially over time rather than dropping all at once. Hence, dirty_decay_ms:1000 means after 1000ms, we'd expect about 50% of dirty pages to be purged back to the OS - same idea for muzzy_decay_ms:1000. We can also set an upper limit on the number of arenas in MALLOC_CONF using the narenas key. In jemalloc, an arena is a large region of memory managed independently, with its own bookkeeping (i.e. free lists, bins, dirty/muzzy lists) and a lock to coordinate access across threads. Less arenas can reduce fragmentation although it could affect throughput due to lock contention - although in an async setting, this wouldn’t be a bottleneck. To start, we have not tested setting this value explicitly - by default, there are 4 times the number of cores - in our case we are running 1 core leaving us with narenas set to 4. Tuning it lower is a knob we can leverage if we continue to see fragmentation. This leaves us with the following configuration:

Then, after some light tests locally and in staging, we deployed and ran it under production traffic for long enough time to validate whether or not this fixed it. And we find that it actually did fix it!
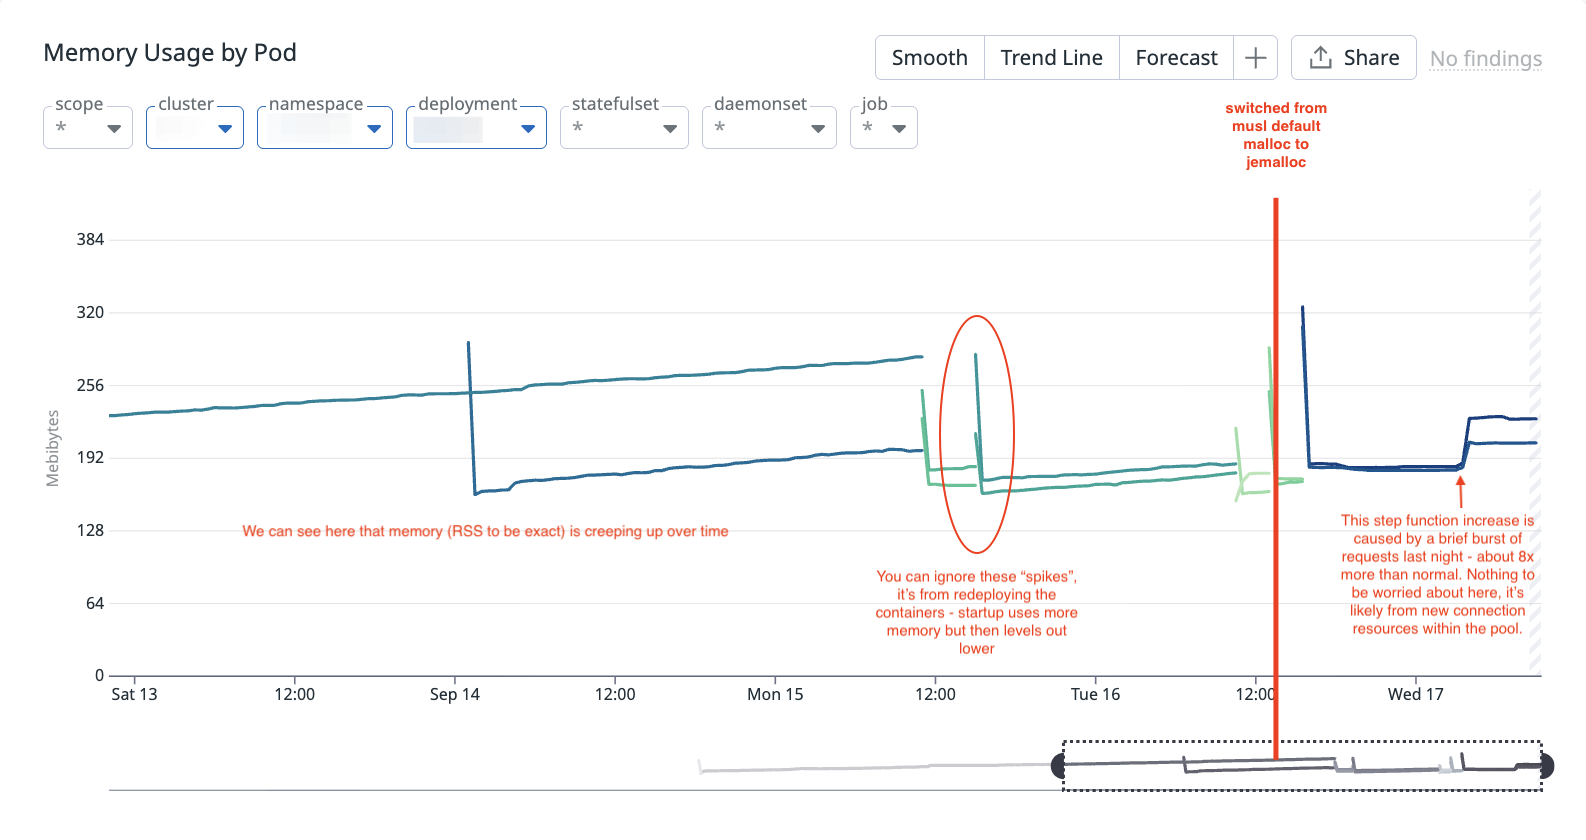
On a timeframe of 9 hours with 2 brief bursts of production traffic, we see that memory holds relatively steady, it is no longer growing linearly across time as we have seen before! The step-like increase was caused by a short burst of ~8x normal traffic. Memory then stabilized at a higher baseline, which is expected behaviour from new connection resource allocation. This is not a leak concern unless we observe repeated step-ups over time, which does not seem to be the case.
9 hour time frame with jemalloc: Memory holds steady even under 2 brief bursts (~8x average rate) of traffic!
In fact, we can quantify the difference in behaviour by measuring the rate at which RSS accumulates under musl’s malloc versus jemalloc. Sampling over one-hour intervals, we observed the following:
- musl’s malloc: RSS increased by roughly 1.25 MB per hour
- jemalloc: RSS increased by roughly 0.12 MB per hour
This indicates that while both allocators still exhibit some degree of fragmentation under our workload, jemalloc’s background purging thread keeps it an order of magnitude lower. In other words, resident memory growth with jemalloc more closely reflects true application usage rather than accumulation of unused pages.
What makes jemalloc well-designed for our particular highly concurrent application?
To better understand this, and why we were running into issues before with musl’s default malloc, let’s draw out how memory is managed by these two allocators.
Both jemalloc and musl’s malloc splits the virtual address space into contiguous blocks of pages (recall, a page is typically 4KiB) - we can refer to these as a run/extent/span; different names for similar concept - for our purposes, let's call it a span. Suppose we have a span of size 16KiB so there are 4 pages in use. After GC, pages 0 and 2 are freed.
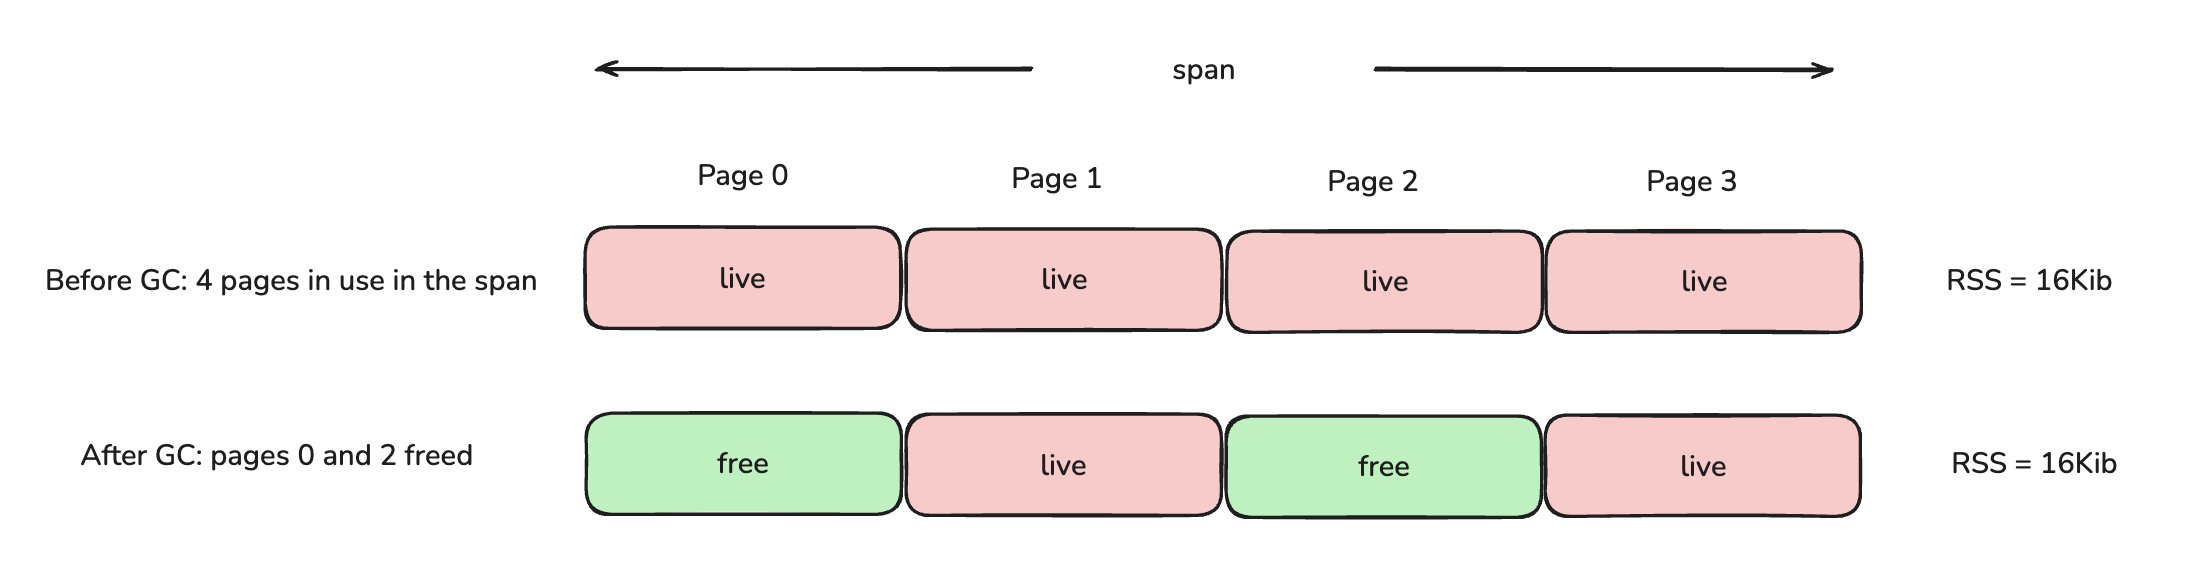
Now, here is a key differences in how musl’s malloc and jemalloc return pages back to the OS.
- musl’s malloc - returns memory back to the OS only when all pages within the span are freed. If there exists any page that is in use, the entire span (all 16KiB) sits in resident (i.e. the physical pages stay mapped and "in use").
- jemalloc - pages 0 and 2 are freed hence marked as dirty. jemalloc runs an async background thread that figures out what to do with these dirty pages (i.e. syscall
madvise) - it finds that they are no longer in use, hence unmaps them from physical memory, so RSS drops to 8KiB with jemalloc.
Since jemalloc actively purges and unmaps unused pages in the background, resident memory more closely tracks true application usage. In contrast, with musl’s malloc, partially free spans accumulate, leaving large amounts of memory resident even when it is no longer needed which manifests as higher fragmentation and steadily growing RSS.
Tying this back into our async FastAPI app, this is exactly the situation we ran into. Each Snowflake request spins up a bunch of Arrow buffers such as data buffers, offset arrays, validity bitmaps, etc. These allocations aren’t uniform in size, and they don’t all live for the same amount of time. Because our FastAPI server is async and serving multiple requests at once, allocations from different requests get interleaved across the same spans.
What that means in practice is that when one request finishes and frees its buffers, other requests still have objects sitting in those same spans. With musl’s malloc, that keeps the entire span resident until everything inside it is gone. Over time, we end up with more and more of these half-empty spans sticking around, and RSS just creeps upward.
With jemalloc, we no longer have this particular behaviour. Once pages inside a span go unused, jemalloc marks them dirty and its background thread comes along later and purges. So even if some pages are still live from other requests, the freed pages are dropped from RSS. That makes resident memory much closer to the actual live set of Arrow buffers in use instead of hanging on to lots of stale pages leading to lots of memory fragmentation overtime.
Lessons Learned
All in all, this investigation was a reminder that not all memory growth is a “leak” in the traditional sense. Python itself wasn’t the culprit, neither was our connection pool logic. The real issue came down to how we configured the C library build using musl. musl’s malloc holds onto partially free spans, which under our async workload that uses Arrow under-the-hood for certain requests, it looked indistinguishable from a leak. By switching to jemalloc, we gave the runtime a more robust allocator that can aggressively purge freed pages, and in doing so we stopped the slow bleed of memory over time. We also observed that under our workload, memory fragmentation in Python can present as near-linear RSS growth even though no true leak is present. While we haven’t rigorously proven this across all cases, it highlights that fragmentation symptoms in Python may differ from heuristics reported for other runtimes like Ruby. In the end, the fix was as much about systems thinking as it was about Python.
About the Author
Jesse Sun is a Machine Learning Engineer on the Data Platform team at BetterUp. He joined full-time in 2023 and is based in Toronto, Canada.
Join the conversation